The problem: a file arrives and nobody checks it
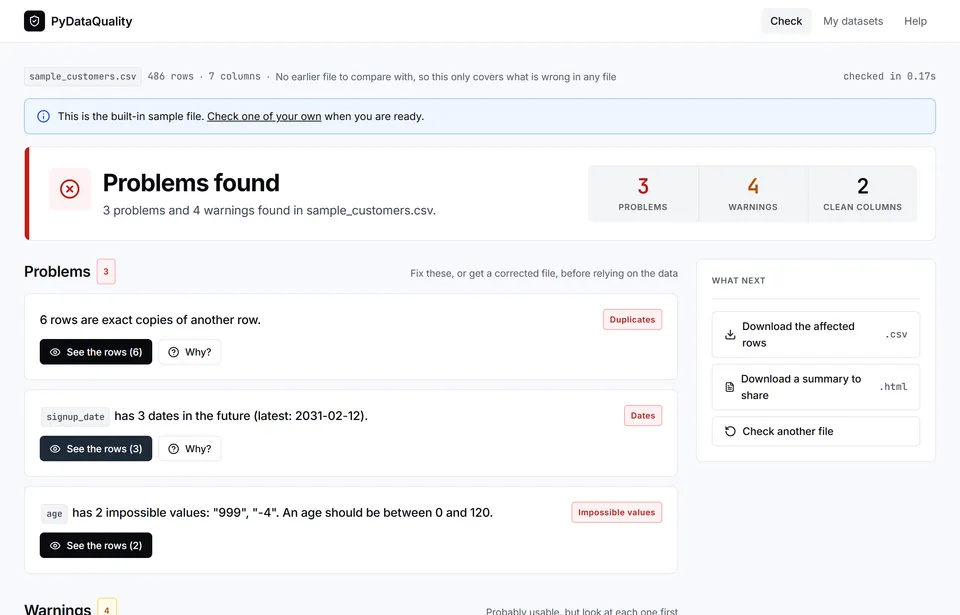
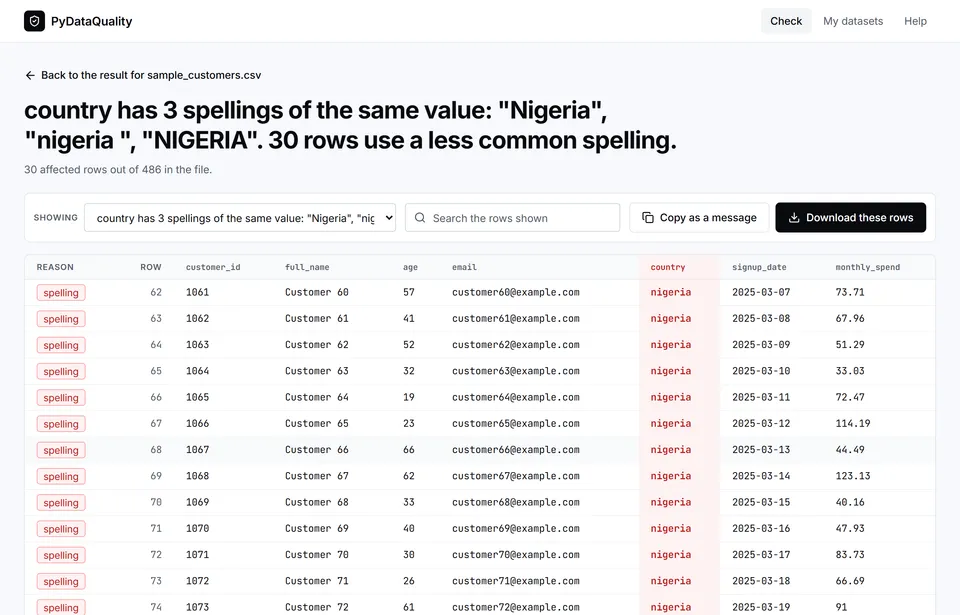
Someone sends you a spreadsheet: a monthly export, a supplier list, a survey download, a bank file. You build a report on it. A week later someone notices the ages include 999, half the dates are in the future, and "Nigeria" is spelled three ways, so every chart was wrong.
Most people do not skip checking because they are careless. They skip it because checking is slow and boring, and the tools for it are built for data engineers with time to write rules. I wanted something you could point at a file and get a straight answer in plain language: is this file safe to use, and what changed since the last one?
What PyDataQuality does
PyDataQuality is an open-source Python tool I designed and built. You give it a CSV, Excel, JSON or Parquet file, and it answers in sentences a non-programmer can act on:
$ pdq check orders_november.csv

✖ NOT SAFE TO USE   3 problems, 5 warnings
  1  1 column is missing: discount_code. It was in orders_september.csv.
  2  order_id had no repeats last time. Now 1 value appears more than once.
  3  order_date has 15 dates in the future (latest: 2031-01-01).
It works in three ways, and all three give the same answer:
- A desktop app for Windows and Mac. Drop a file in, read the verdict, click any finding to see the rows behind it.
- A command,
pdq check file.csv, for quick checks and scheduled jobs. - A Python library,
pdq.check(df), for notebooks and pipelines.
Step 1: check a file once
The first time, there is nothing to compare with, so it looks for what is wrong in any file: exact duplicate rows, IDs that repeat, impossible values (an age of 999), dates in the future, mixed date formats, invalid emails, one value spelled several ways, numbers stored as text, and numbers wildly outside the usual range. Before judging a column it works out what kind of column it is, so it never runs outlier checks on ID numbers.
It is deliberately quiet. A tool that cries wolf gets ignored, so a clean file simply says nothing obviously wrong.
Step 2: tell it what normal looks like
pdq accept file.csv saves a small, readable description of the file: its columns, their types, allowed values, ranges and how often they are empty. You write no rules. PyDataQuality learns them from a file you approve.
Step 3: check the next file against it
Next month, the new file is compared with what was learned. Now it can also say that a column disappeared, the file has 60% fewer rows, a category value has never been seen before, or a number column has shifted. That last one uses a statistic called the Population Stability Index, which I explain in a lesson anyone can follow.
Step 4: act on it
pdq rows saves the affected rows with a reason on each one, so you can send them back to whoever produced the file. A fix feature is built and coming in the next release: it saves a corrected copy plus a list of every change, and only makes changes you approve. Your original file is never touched.
Built for privacy
Data files often hold personal and financial information, so privacy is a design rule, not a feature. PyDataQuality makes no network requests, has no account and no telemetry. The browser app is served from your own computer and only answers to it. Anything it can share, such as an AI-assistant prompt, leaves out values from columns that look like personal data unless you ask otherwise.
The maths, in one paragraph
Under the plain sentences there is real statistics. Unusual numbers are found with the interquartile range, the spread of the middle half of the data, checked on a log scale too so that ordinary long-tailed data such as incomes is left alone. Changes between files are measured with the Population Stability Index, and the profiling tools add the Kolmogorov-Smirnov test and Shannon entropy. Each one is explained step by step, with worked examples, in the lessons below.
The research paper
The design, the profiling kernel and the drift statistics are written up in a research paper:
PyDataQuality: An Actionable, Lightweight Data Profiling and Distribution Drift Detection Framework for Production Machine Learning Pipelines. Dominion Akinrotimi, 2026. Preprint, Zenodo. DOI: 10.5281/zenodo.22211750
The paper is public as a preprint on Zenodo, CERN's open research repository. That gives it a permanent DOI so anyone can read and cite it today, but a preprint has not been through peer review. I am now looking for the right peer-reviewed journal for it. The software itself is archived on Zenodo too, with its own DOI for each release (10.5281/zenodo.23344748).
If you edit or review for a journal in data engineering, research software or applied machine learning, or can recommend one, I would value a message.
Try it
pip install pydataquality
pdq ui
That opens the app in your browser with a sample file to try first. Or download the desktop app from the website, no Python needed.
What I learned building it
- Quiet beats clever. The first real file I tested, a bank statement with a title block above the table, produced false alarms. Fixing those taught me more than any benchmark: real files have title rows, dashes for empty cells and debit and credit columns that are each half empty by design.
- Sell the answer, not the statistics. People do not want a 200-page profile. They want "safe" or "not safe", and the rows to fix.
- Privacy has to be designed in, not added later. No account, no telemetry and no network requests means there is nothing to leak.
Need this kind of work done?
I take on data engineering, analytics, machine learning and research projects, and I speak and train teams on data and AI.