The question: do smartphone users fall into natural groups by how they use their phones, and is heavy use an age thing?
What I did: analysed 700 users' app time, screen time, battery drain, apps installed and data use with clustering and statistical tests.
Findings
- Usage measures move together. App time, screen time, battery drain and data use correlate at 0.94 to 0.96.
- K-means finds five clear groups (k chosen by elbow and silhouette), and they line up with the dataset's five behaviour classes.
- Age doesn't matter here. ANOVA on screen time across age groups gives p = 0.99, and a chi-square test of age group against behaviour class gives p = 0.49.
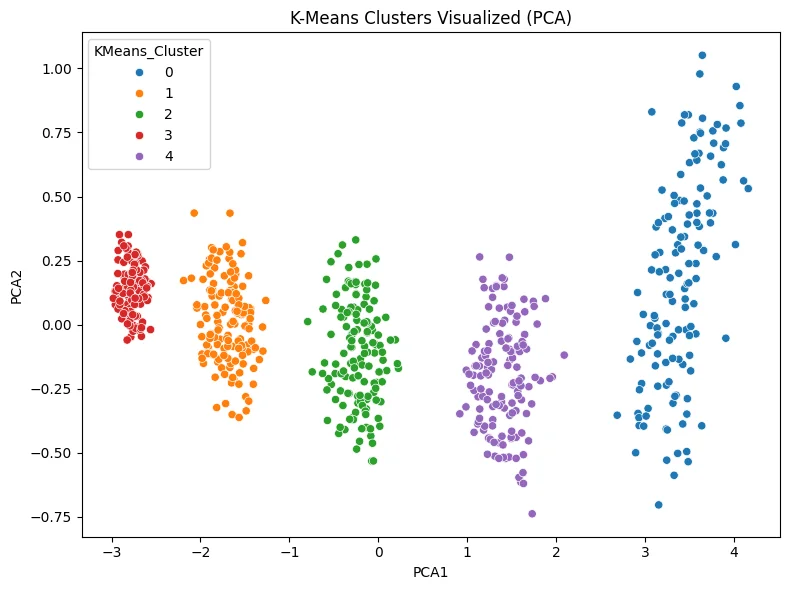
K-means clusters on the first two principal components.
About the 100% accuracy: the decision tree and random forest classify the behaviour class perfectly. That's because the class is defined from the same usage measures, so the models are recovering a rule rather than predicting something hidden. The useful results are the clustering and the age tests.