The problem: a company showed ads to most users and a public service announcement to a control group. Did the ads actually lift purchases, or would those customers have bought anyway?
What I did: analysed 518,565 users with a two-proportion z-test, then looked at how conversion changes with the number of ads seen.
Result
| Group | Conversion rate |
|---|---|
| Saw the ads | 2.81% |
| Saw the PSA (control) | 2.25% |
That's a lift of 0.56 percentage points, about 25% relative, with z = 4.28 (p < 0.001). Users were randomly assigned to the groups, so the lift can be credited to the ads.
More ads, more sales?
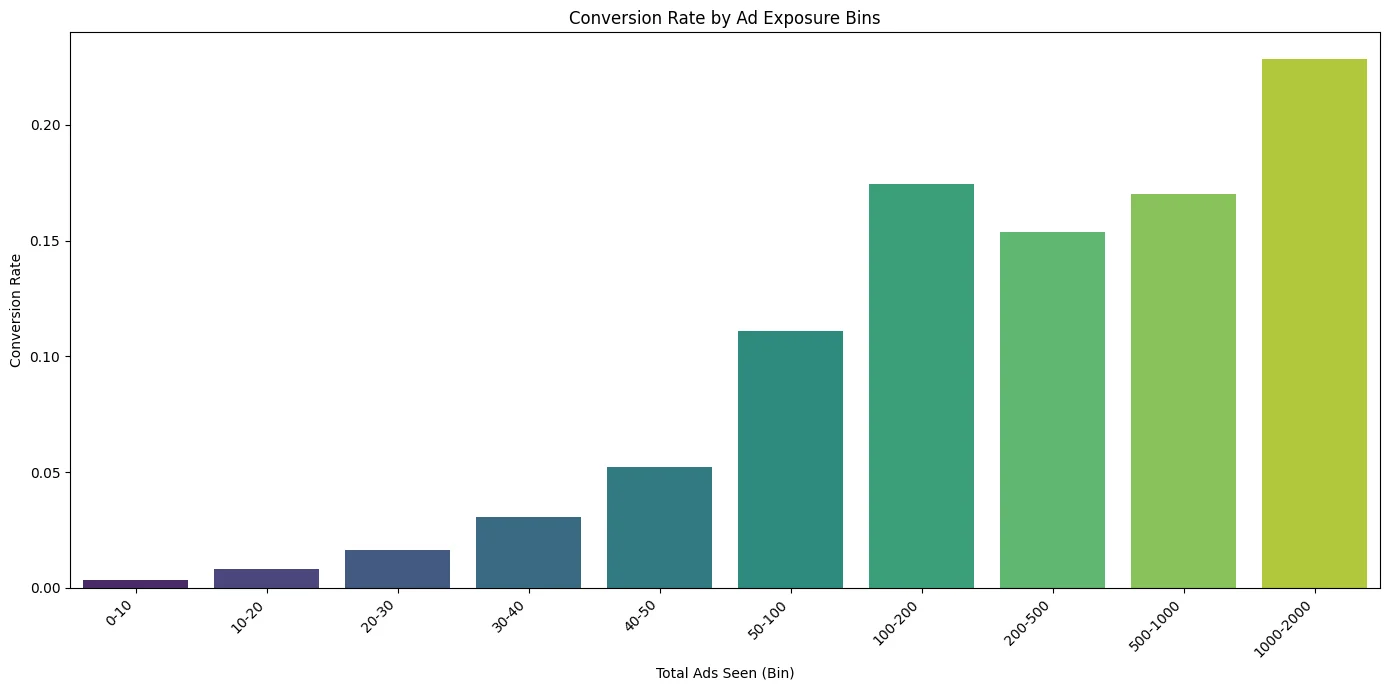
Conversion by number of ads seen, ad group only.
Read with care: conversion climbs from 0.4% (0 to 10 ads) to about 17% (100 to 200 ads), but exposure wasn't randomised. People who browse more both see more ads and buy more. This curve shows association, not the effect of adding ads.
Recommendations
- Keep the campaign: the randomised comparison shows a real lift.
- Before raising ad volume, run a frequency-cap test (for example 10, 30 and 100 ads per user) to find where extra ads stop paying.
- Schedule ads by the day and hour patterns broken down in the notebook.